California Public School Enrollment - Ethnicity

| Year | White | Latinx |
|---|---|---|
| 1981 | 56% | 26% |
| 2016 | 24% | 54% |
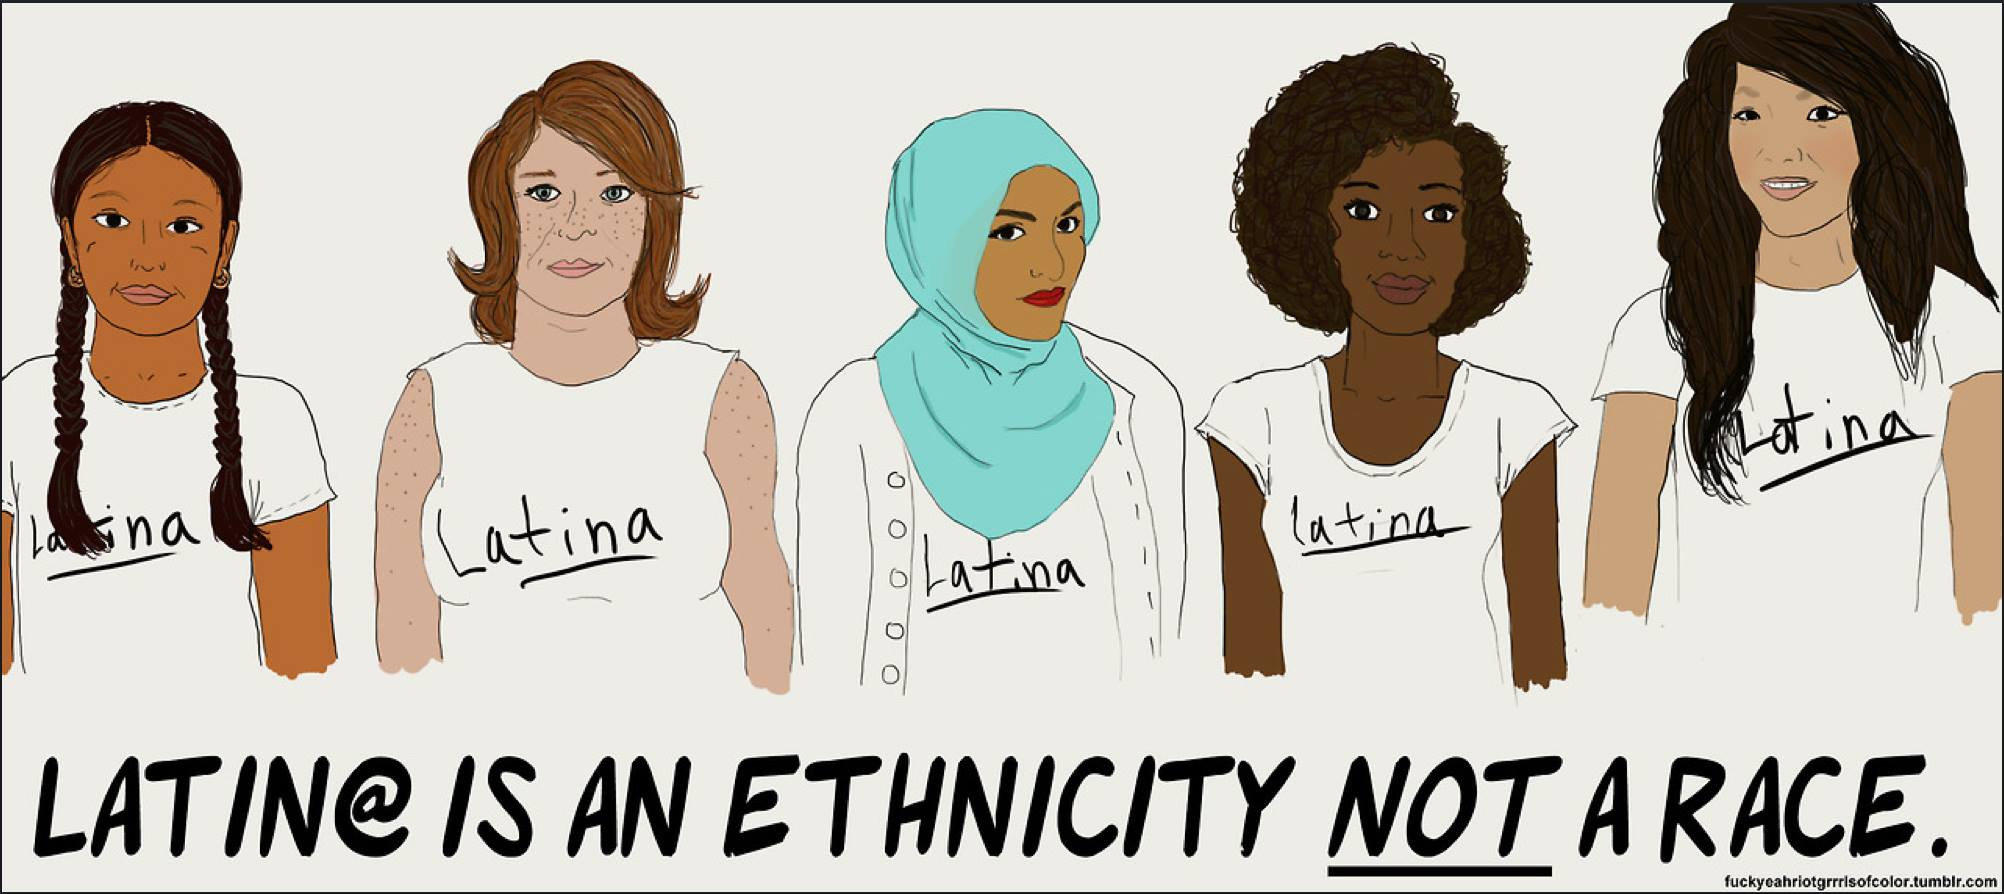
I will use CA ethnicity data in future enrollment analyses and find the variable thought-provoking.
The multiple choice options we provide our students have gone through the following changes over time:
| ID | 2009-2016 | 1998-2008 | 1993-1997 | 1981-1992 |
|---|---|---|---|---|
| 0 | Not reported | |||
| 1 | American Indian or Alaska Native, Not Hispanic | American Indian or Alaska Native | American Indian or Alaska Native | American Indian or Alaska Native |
| 2 | Asian, Not Hispanic | Asian | Asian | Asian |
| 3 | Pacific Islander, Not Hispanic | Pacific Islander | Pacific Islander | Pacific Islander |
| 4 | Filipino, Not Hispanic | Filipino | Filipino | Filipino |
| 5 | Hispanic or Latino | Hispanic or Latino | Hispanic or Latino | Hispanic or Latino |
| 6 | African American, not Hispanic | African American, not Hispanic | Black, not Hispanic | Black, not Hispanic |
| 7 | White, not Hispanic | White, not Hispanic | White, not Hispanic | White, not Hispanic |
| 8 | Multiple or No Response | |||
| 9 | Two or More Races, Not Hispanic |
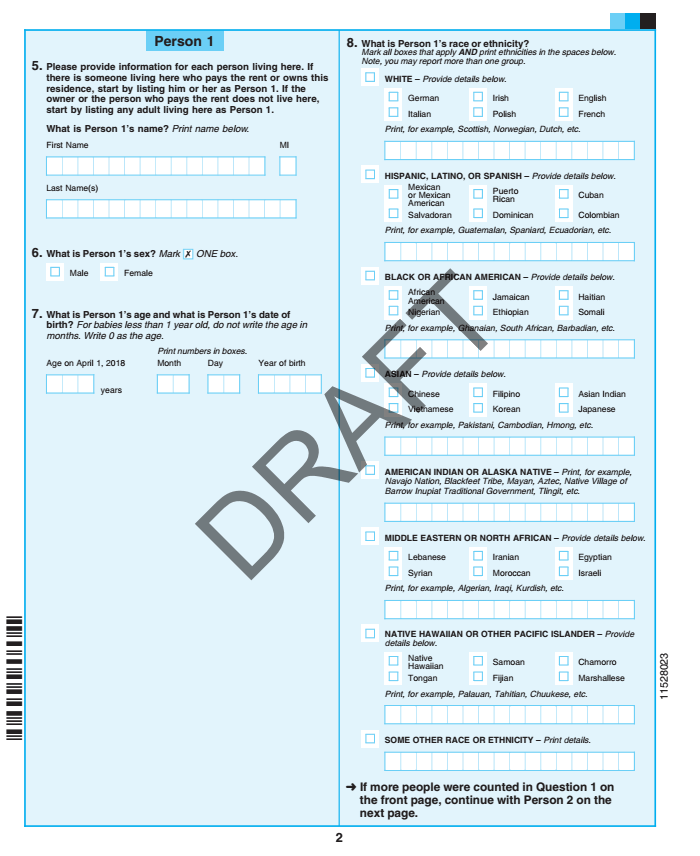
The recent shift to “Not Hispanic” on every option other than 5: “Hispanic or Latino” indicates that California wants more kids to check the “Hispanic or Latino” box. This may have something to do with categorical funding, and I will be looking into the funding formula in future posts. Getting folks to choose “Hispanic or Latino” has been an issue for the US Census also, and the proposed form may be of interest here:

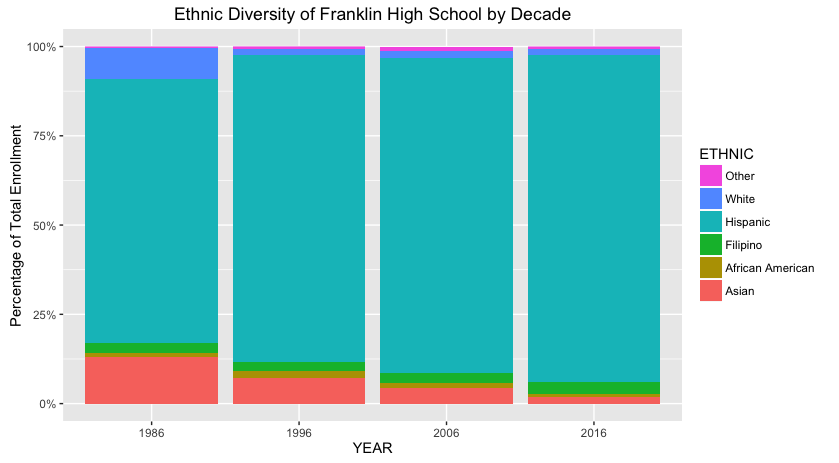
While exploring CA Enrollment Data I got this plot:

It was interesting. Because I taught there. And it got me thinking that stacked bars for each year for every school, clustered by county, might be fun for people from those counties to look at. Not sure if enrollment totals or enrollment proportion are more interesting to folks - let me know in the comments.
kop _crushton
