
California Public Enrollment Data
Charter schools are stealing our students and destroying public education.
Students are leaving public schools because they have better charter options.
I hope to eventually explore the two clickbait claims above. The primary purpose of this enrollment project is to address them, get in touch if this interests you. Source code is available on github
This post outlines my process to explore California enrollment data starting from the raw form on the web.
I will follow a process similar to EliteDataScience:
As I progress though the steps, I will write additional posts to share results and/or go into specifics on troubleshooting technical difficulties.
Exploration
CA Student & School Data Files can be found on California’s DoE website. They are tab delimited .txt files with fields that vary across years.
Enrollment
Within student enrollment data lies a story. I hope that visualizing the data will encourage others to tell their sides of that story and bring it to light.
Data files are saved on a yearly basis with minor field changes across 4 timespans (‘81-92, ‘93-97, ‘98-08, ‘09-16). Mainly, the changes are to racial/ethnic designation codes, so analysis involving ethnicity will require some wrangling.
Here is quick exploration of ‘92, ‘97, ‘08, ‘16 enrollment data.
Using Dataframes
df9798 <- read.table("./Data/ent1997-1998.txt", fill=TRUE, na.strings=c("", "NA"), sep ="\t", quote = "", header=TRUE)
df0809 <- read.table("./Data/rol2008-2009.txt", fill=TRUE, na.strings=c("", "NA"), sep ="\t", quote = "", header=TRUE)
df1617 <- read.table("./Data/rol2016-2017.txt", fill=TRUE, na.strings=c("", "NA"), sep ="\t", quote = "", header=TRUE)
> head(df0809)
        CDS_CODE    COUNTY              DISTRICT              SCHOOL ETHNIC GENDER KDGN GR_1 GR_2 GR_3 GR_4 GR_5 GR_6 GR_7 GR_8 UNGR_ELM GR_9 GR_10 GR_11 GR_12 UNGR_SEC ENR_TOTAL ADULT
1 33671243331071 Riverside Moreno Valley Unified Vista del Lago High      4      M    0    0    0    0    0    0    0    0    0        0    5    14     7     6        0        32     0
2 33671243331071 Riverside Moreno Valley Unified Vista del Lago High      5      F    0    0    0    0    0    0    0    0    0        0  199   225   183   151        0       758     0
3 33671243331071 Riverside Moreno Valley Unified Vista del Lago High      5      M    0    0    0    0    0    0    0    0    0        0  239   229   191   152        0       811     0
4 33671243331071 Riverside Moreno Valley Unified Vista del Lago High      8      M    0    0    0    0    0    0    0    0    0        0    3     5     3     1        0        12     0
5 33671243331071 Riverside Moreno Valley Unified Vista del Lago High      2      M    0    0    0    0    0    0    0    0    0        0   10    13     8     9        0        40     0
6 33671243331071 Riverside Moreno Valley Unified Vista del Lago High      1      M    0    0    0    0    0    0    0    0    0        0    1     2     3     1        0         7     0
> str(df1617)
'data.frame':	129813 obs. of  23 variables:
$ CDS_CODE : num  30665226028690 30665226028690 30665226028690 30665226028690 30665226028690 ...
$ COUNTY   : Factor w/ 58 levels "Alameda","Alpine",..: 30 30 30 30 30 30 30 30 30 30 ...
$ DISTRICT : Factor w/ 1012 levels "ABC Unified",..: 305 305 305 305 305 305 305 305 305 305 ...
$ SCHOOL   : Factor w/ 8745 levels "21st Century Learning Institute",..: 6030 6030 6030 6030 6030 6030 6030 6030 6030 6030 ...
$ ETHNIC   : int  2 4 7 6 4 9 5 3 2 0 ...
$ GENDER   : Factor w/ 2 levels "F","M": 1 2 1 1 1 2 1 2 2 1 ...
> str(df0809)
'data.frame':	121068 obs. of  23 variables:
$ CDS_CODE : num  33671243331071 33671243331071 33671243331071 33671243331071 33671243331071 ...
$ COUNTY   : Factor w/ 58 levels "Alameda","Alpine",..: 33 33 33 33 33 33 33 33 33 33 ...
$ DISTRICT : Factor w/ 1031 levels "ABC Unified",..: 578 578 578 578 578 578 578 578 578 578 ...
$ SCHOOL   : Factor w/ 8517 levels "A. E. Arnold Elementary",..: 8005 8005 8005 8005 8005 8005 8005 8005 8005 8005 ...
$ ETHNIC   : int  4 5 5 8 2 1 7 6 6 8 ...
> str(df9798)
'data.frame':	89053 obs. of  20 variables:
$ CDS_CODE : num  1100170130401 1100170130401 1100170130401 1100170130401 1100170130401 ...
$ ETHNIC   : int  1 1 2 2 3 4 4 5 5 6 ...
$ GENDER   : Factor w/ 2 levels "F","M": 1 2 1 2 2 1 2 1 2 1 ...
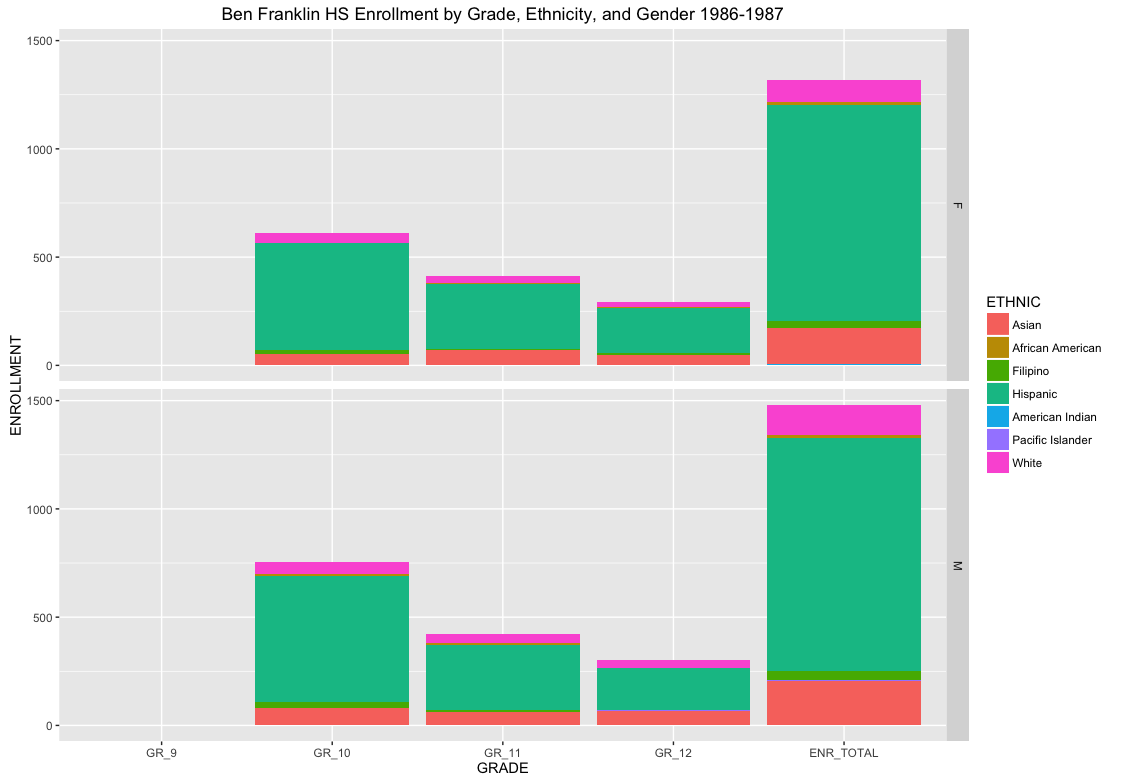
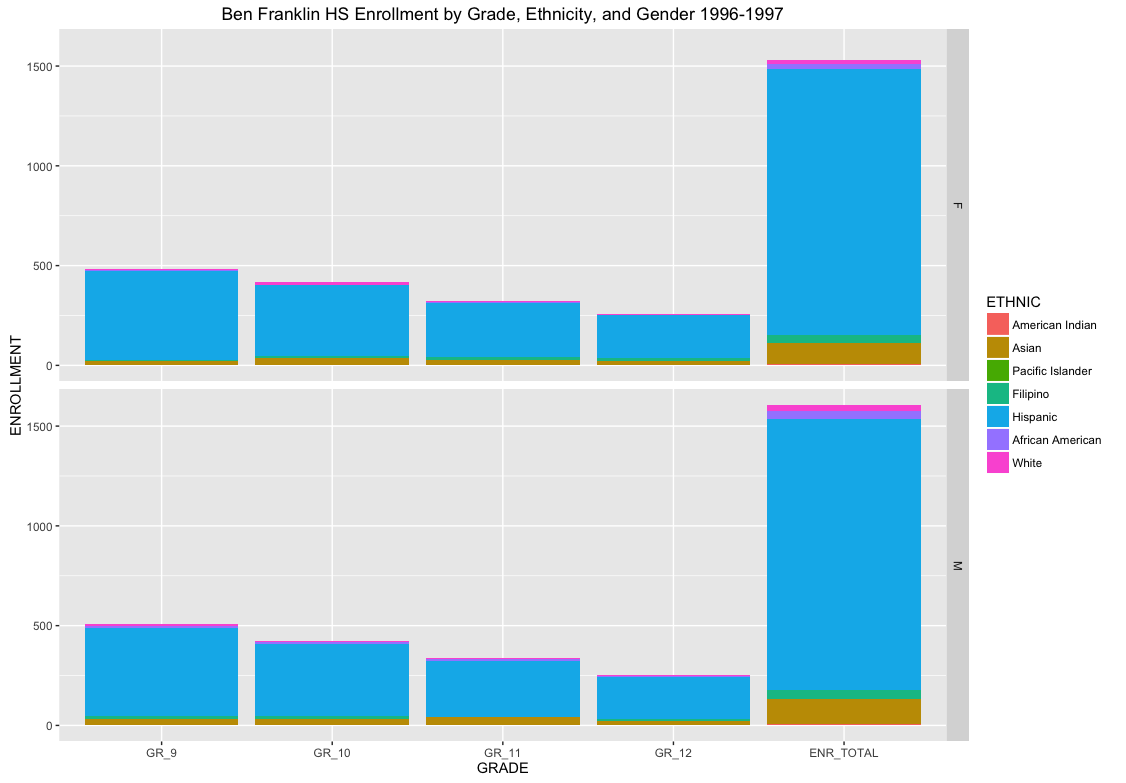
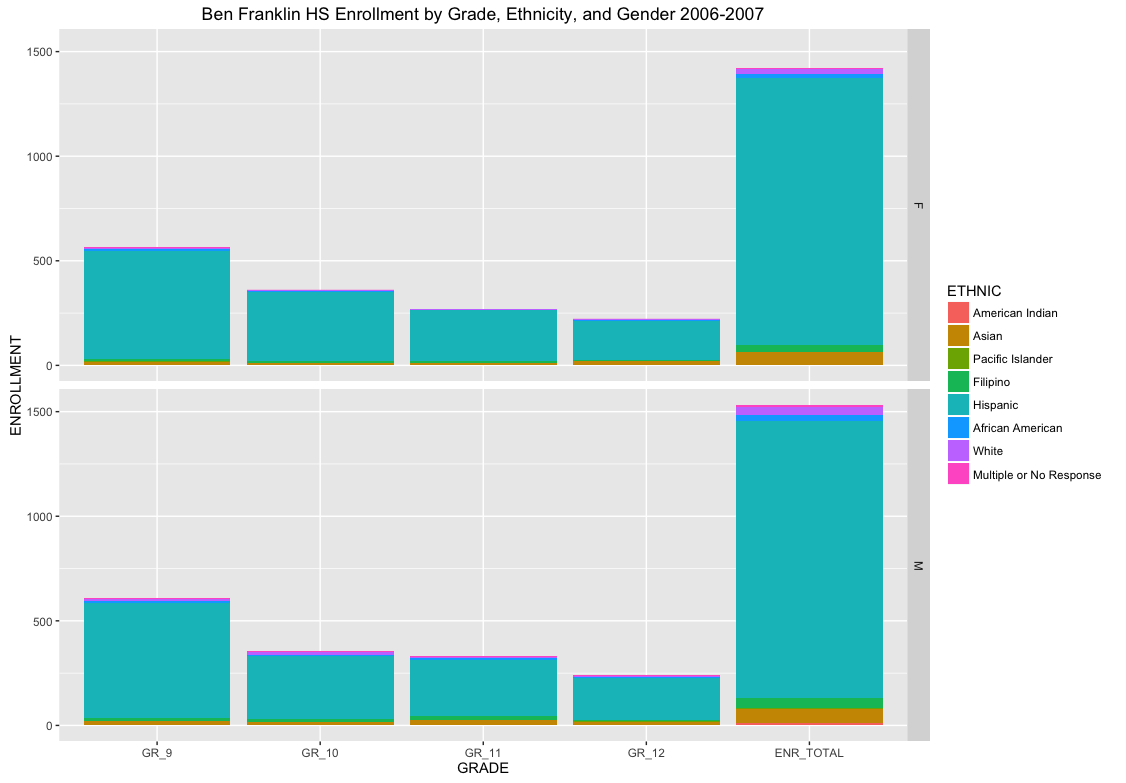
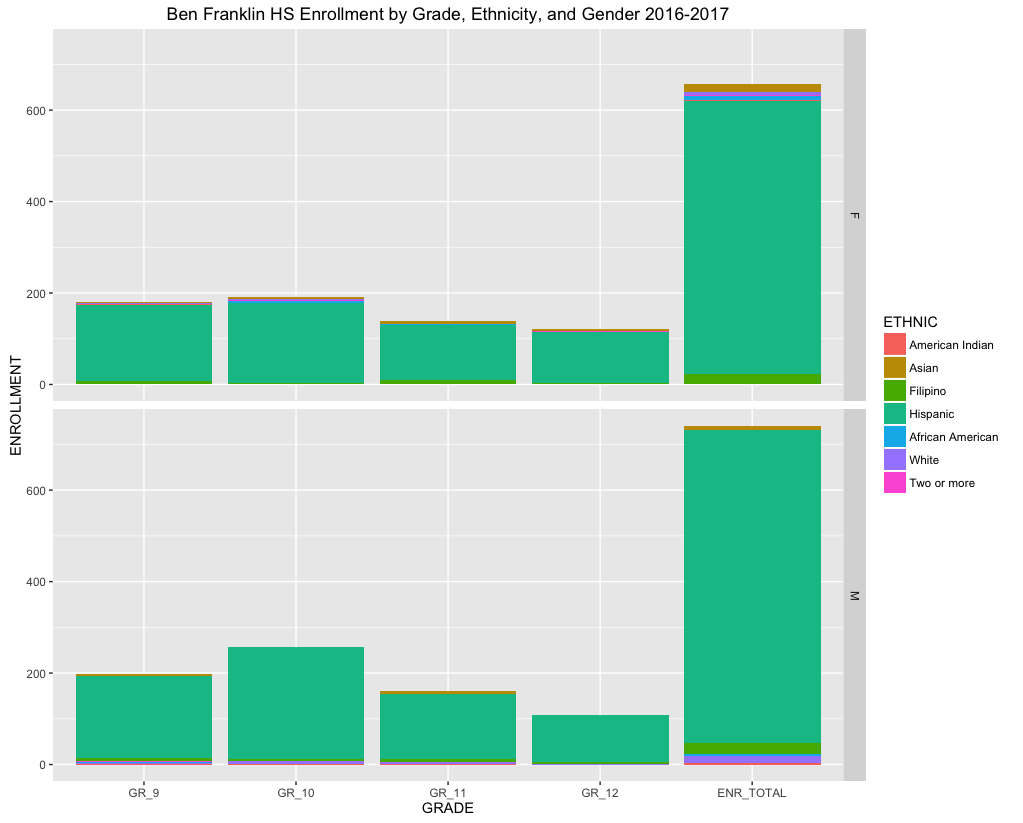
All of the data contains a CDS_CODE that is a unique identifier for County, District, School. This is ideal for linking data across tables. Notice that school enrollment is seperated across ethnicity, gender, and grade. Therefore, for any given school we can get a breakdown of the student population across these factors. For example, Benjamin Franklin High School (where I taught) has the following enrollments by grade, ethnicity, and gender across 4 decades:
Cleaning
I first convert a list of data frames to data tables:
# Returns a datatable from a list of tab delimited files and a list of names
listToDataTable <- function(file.list, names.list, id) {
DT.list <- lapply(file.list, read.table, fill=TRUE, na.strings=c("", "NA"), sep ="\t", quote = "", header=TRUE)
setattr(DT.list, 'names', names.list)
return(rbindlist(DT.list, use.names=TRUE, fill=TRUE, idcol=id))
}
I will bind the data tables across years together into one large data.table in order to visualize change over time. Before doing so, I need to make sure that the column headers are the same for each data table and each col contains the same type of data.
NA Values
While binding tables together, many NA values have been introduced. Much of this can be explained by schools opening and closing. Additionally, the master list of schools for California is only kept up-to-date, meaning that historical data on schools that have since closed or changed CDS_CODE needs to be recreated from what data we can find in the enrollment files.
Luckily, the ‘92 data file does include county and school name information along with CDS_CODES - so we can recover some NA_VALUES. I go into more detail about this in my Data Cleaning post.
Features
The first thing to notice is that enrollments seem to be decreasing in many areas even though population has been rising. Normalizing for population growth seems like something worth trying.
In California, a child must be five years old BEFORE September 1 in order to enroll in kindergarten. Elementary school is kindergarten through 5th grade (ages 5-10), middle school is grades 6-8 (ages 11-13), and high school is grades 9-12 (ages 14-18). I will use these figures copied from a Stanford resource to define school-aged children and pull that data from Census resources.
To understand locations where enrollment is trending down or trending up we can create an enrollment trending score feature.
To identify schools with high diversity entropy and low diversity entropy we can create a diversity entropy score feature.
To identify schools with high class entropy and low class entropy we can create a class entropy score feature.
Who gets pushed out of schools? Opportunity transfers, expulsions, and suspension rates are things to look into if there is enough data going back.
Algorithm
Model
Conclusions
There are many claims about lowered enrollment in public schools. I taught at Franklin Sr. High School and experienced the following drop in enrollment: